This is the twenty-first in a series of blog posts I’m doing on the VS 2010 and .NET 4 release. Today’s blog post covers a few of the nice usability improvements coming with the VS 2010 debugger.
The VS 2010 debugger has a ton of great new capabilities. Features like Intellitrace (aka historical debugging), the new parallel/multithreaded debugging capabilities, and dump debuging support typically get a ton of (well deserved) buzz and attention when people talk about the debugging improvements with this release. I’ll be doing blog posts in the future that demonstrate how to take advantage of them as well.
With today’s post, though, I thought I’d start off by covering a few small, but nice, debugger usability improvements that were also included with the VS 2010 release, and which I think you’ll find useful.
Breakpoint Labels
VS 2010 includes new support for better managing debugger breakpoints. One particularly useful feature is called “Breakpoint Labels” – it enables much better grouping and filtering of breakpoints within a project or across a solution.
With previous releases of Visual Studio you had to manage each debugger breakpoint as a separate item. Managing each breakpoint separately can be a pain with large projects and for cases when you want to maintain “logical groups” of breakpoints that you turn on/off depending on what you are debugging. Using the new VS 2010 “breakpoint labeling” feature you can now name these “groups” of breakpoints and manage them as a unit.
Grouping Multiple Breakpoints Together using a Label
Below is a screen-shot of the breakpoints window within Visual Studio 2010. This lists all of the breakpoints defined within my solution (which in this case is the ASP.NET MVC 2 code base):
The first and last breakpoint in the list above breaks into the debugger when a Controller instance is created or released by the ASP.NET MVC Framework.
Using VS 2010, I can now select these two breakpoints, right-click, and then select the new “Edit labels…” menu command to give them a common label/name (making them easier to find and manage):
Below is the dialog that appears when I select the “Edit labels” command. We can use it to create a new string label for our breakpoints or select an existing one we have already defined. In this case we’ll create a new label called “Lifetime Management” to describe what these two breakpoints cover:
When we press the OK button our two selected breakpoints will be grouped under the newly created “Lifetime Management” label:
Filtering/Sorting Breakpoints by Label
We can use the “Search” combobox to quickly filter/sort breakpoints by label. Below we are only showing those breakpoints with the “Lifetime Management” label:
Toggling Breakpoints On/Off by Label
We can also toggle sets of breakpoints on/off by label group. We can simply filter by the label group, do a Ctrl-A to select all the breakpoints, and then enable/disable all of them with a single click:
Importing/Exporting Breakpoints
VS 2010 now supports importing/exporting breakpoints to XML files – which you can then pass off to another developer, attach to a bug report, or simply re-load later.
To export only a subset of breakpoints, you can filter by a particular label and then click the “Export breakpoint” button in the Breakpoints window:
Above I’ve filtered my breakpoint list to only export two particular breakpoints (specific to a bug that I’m chasing down). I can export these breakpoints to an XML file and then attach it to a bug report or email – which will enable another developer to easily setup the debugger in the correct state to investigate it on a separate machine.
Pinned DataTips
Visual Studio 2010 also includes some nice new “DataTip pinning” features that enable you to better see and track variable and expression values when in the debugger.
Simply hover over a variable or expression within the debugger to expose its DataTip (which is a tooltip that displays its value) – and then click the new “pin” button on it to make the DataTip always visible:
You can “pin” any number of DataTips you want onto the screen. In addition to pinning top-level variables, you can also drill into the sub-properties on variables and pin them as well.
Below I’ve “pinned” three variables: “category”, “Request.RawUrl” and “Request.LogonUserIdentity.Name”. Note that these last two variable are sub-properties of the “Request” object.
Associating Comments with Pinned DataTips
Hovering over a pinned DataTip exposes some additional UI within the debugger:
Clicking the comment button at the bottom of this UI expands the DataTip - and allows you to optionally add a comment with it:
This makes it really easy to attach and track debugging notes:
Pinned DataTips are usable across both Debug Sessions and Visual Studio Sessions
Pinned DataTips can be used across multiple debugger sessions. This means that if you stop the debugger, make a code change, and then recompile and start a new debug session - any pinned DataTips will still be there, along with any comments you associate with them.
Pinned DataTips can also be used across multiple Visual Studio sessions. This means that if you close your project, shutdown Visual Studio, and then later open the project up again – any pinned DataTips will still be there, along with any comments you associate with them.
See the Value from Last Debug Session (Great Code Editor Feature)
How many times have you ever stopped the debugger only to go back to your code and say:
$#@! – what was the value of that variable again???
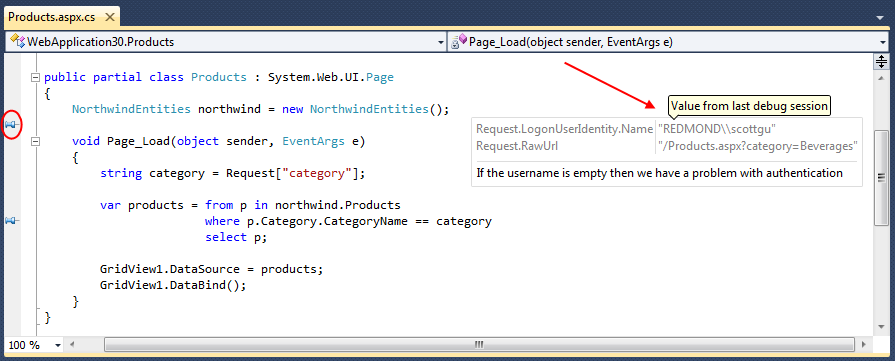
One of the nice things about pinned DataTips is that they keep track of their “last value from debug session” – and you can look these values up within the VB/C# code editor even when the debugger is no longer running.
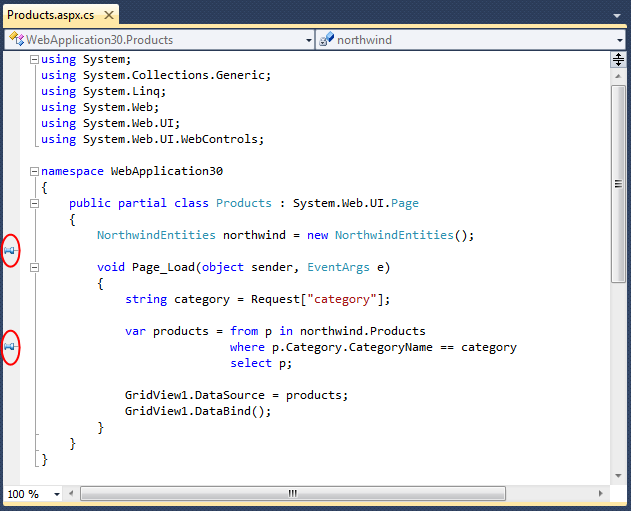
DataTips are by default hidden when you are in the code editor and the debugger isn’t running. On the left-hand margin of the code editor, though, you’ll find a push-pin for each pinned DataTip that you’ve previously setup:
Hovering your mouse over a pinned DataTip will cause it to display on the screen. Below you can see what happens when I hover over the first pin in the editor - it displays our debug session’s last values for the “Request” object DataTip along with the comment we associated with them:
This makes it much easier to keep track of state and conditions as you toggle between code editing mode and debugging mode on your projects.
Importing/Exporting Pinned DataTips
As I mentioned earlier in this post, pinned DataTips are by default saved across Visual Studio sessions (you don’t need to do anything to enable this).
VS 2010 also now supports importing/exporting pinned DataTips to XML files – which you can then pass off to other developers, attach to a bug report, or simply re-load later.
Combined with the new support for importing/exporting breakpoints, this makes it much easier for multiple developers to share debugger configurations and collaborate across debug sessions.
Summary
Visual Studio 2010 includes a bunch of great new debugger features – both big and small.
Today’s post shared some of the nice debugger usability improvements. All of the features above are supported with the Visual Studio 2010 Professional edition (the Pinned DataTip features are also supported in the free Visual Studio 2010 Express Editions)
I’ll be covering some of the “big big” new debugging features like Intellitrace, parallel/multithreaded debugging, and dump file analysis in future blog posts.
Hope this helps,


No comments:
Post a Comment