[In addition to blogging, I am also now using Twitter for quick updates and to share links. Follow me at: twitter.com/scottgu]
This is the fifteenth in a series of blog posts I’m doing on the upcoming VS 2010 and .NET 4 release. Today’s post covers a nice addition to ASP.NET and Windows Forms with .NET 4 - built-in charting control support.
ASP.NET and Windows Forms Charting Controls
A little over 14 months ago I blogged about how Microsoft was making available a free download of charting controls for both ASP.NET 3.5 and Windows Forms 3.5.
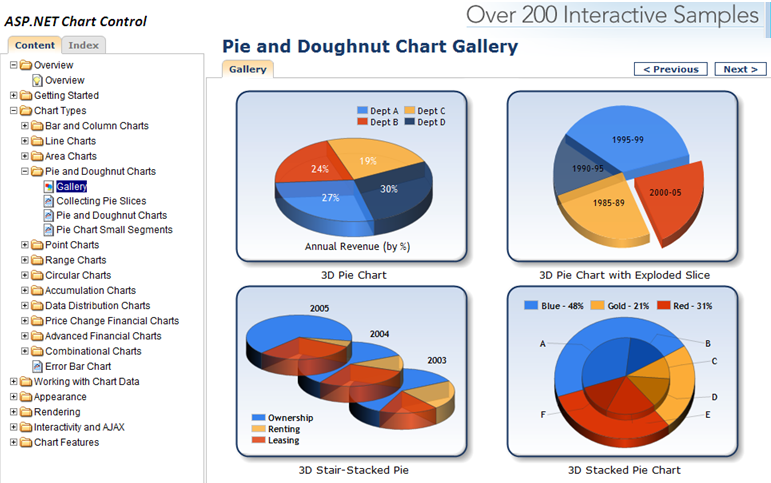
You can download and use these runtime controls for free within your web and client applications today. You can also download VS 2008 tooling support for them. They provide a rich set of charting capabilities that is easy to use. To get a sense of what all you can do with them, I recommend downloading the ASP.NET and Windows Forms sample projects which provide more than 200 samples within them. Below is a screen-shot of some pie and doughnut chart samples from the ASP.NET sample application:
Charting Controls Now Built-into .NET 4
With .NET 3.5 you had to separately download the chart controls and add them into your application. With .NET 4 these controls are now built-into ASP.NET 4 and Windows Forms 4 – which means you can immediately take advantage of them out of the box (no separate download or registration required).
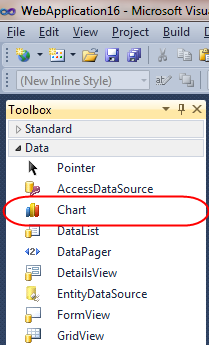
Within ASP.NET 4 applications you’ll find that there is now a new built-in
You can use this control without having to register or wire-up any configuration file entries. All of the charting control configuration is now pre-registered with ASP.NET 4 (meaning nothing has to be added to an application’s web.config file for them to work). This enables you to maintain very clean and minimal Web.config files.
Learning more about the control
Scott Mitchell has written a great series of articles on the www.4guysfromrolla.com site on how to take advantage of the
- Getting Started - walks through getting started using the Chart Controls, from version requirements to downloading and installing the Chart Controls, to displaying a simple chart in an ASP.NET page.
- Plotting Chart Data - examines the multitude of ways by which data can be plotted on a chart, from databinding to manually adding the points one at a time.
- Rendering the Chart - the Chart Controls offer a variety of ways to render the chart data into an image. This article explores these options.
- Sorting and Filtering Chart Data - this article shows how to programmatically sort and filter the chart's data prior to display.
- Programmatically Generating Chart Images - learn how to programmatically create and alter the chart image file.
- Creating Drill Down Reports - see how to build drill down reports using the Chart control.
- Adding Statistical Formulas - learn how to add statistical formulas, such as mean, median, variance, and forecasts, to your charts.
- Enhancing Charts With Ajax - improve the user experience for dynamic and interactive charts using Ajax.
- Serializing Chart Data - see how to persist a chart's data and appearance to a persistent store.
His articles are written using .NET 3.5 and the separate ASP.NET charting controls download – but all of the concepts and syntax work out of the box exactly the same with ASP.NET 4.
Michael Ceranski has also written a blog post demonstrating how to use the ASP.NET Chart control within an ASP.NET MVC application. I’m hoping someone will create some nice ASP.NET MVC Html.Chart() helper methods soon that will make this even easier to do in the future.
Hope this helps,
Scott


No comments:
Post a Comment